If you are a movie lover, you will surely know the two popular websites called Box Office Mojo and IMDb, the former tracks movie revenue across the globe while the latter is an online database information related to film, televisions, home videos etc.,. In this project, I use Python and Power BI to ingest, transform and analyze data from these real-world use cases. Particularly, the focus is on the analysis of all movies shown in Vietnam during the period from 2009 and 2024.

Web scraping with Python and BeautifulSoup
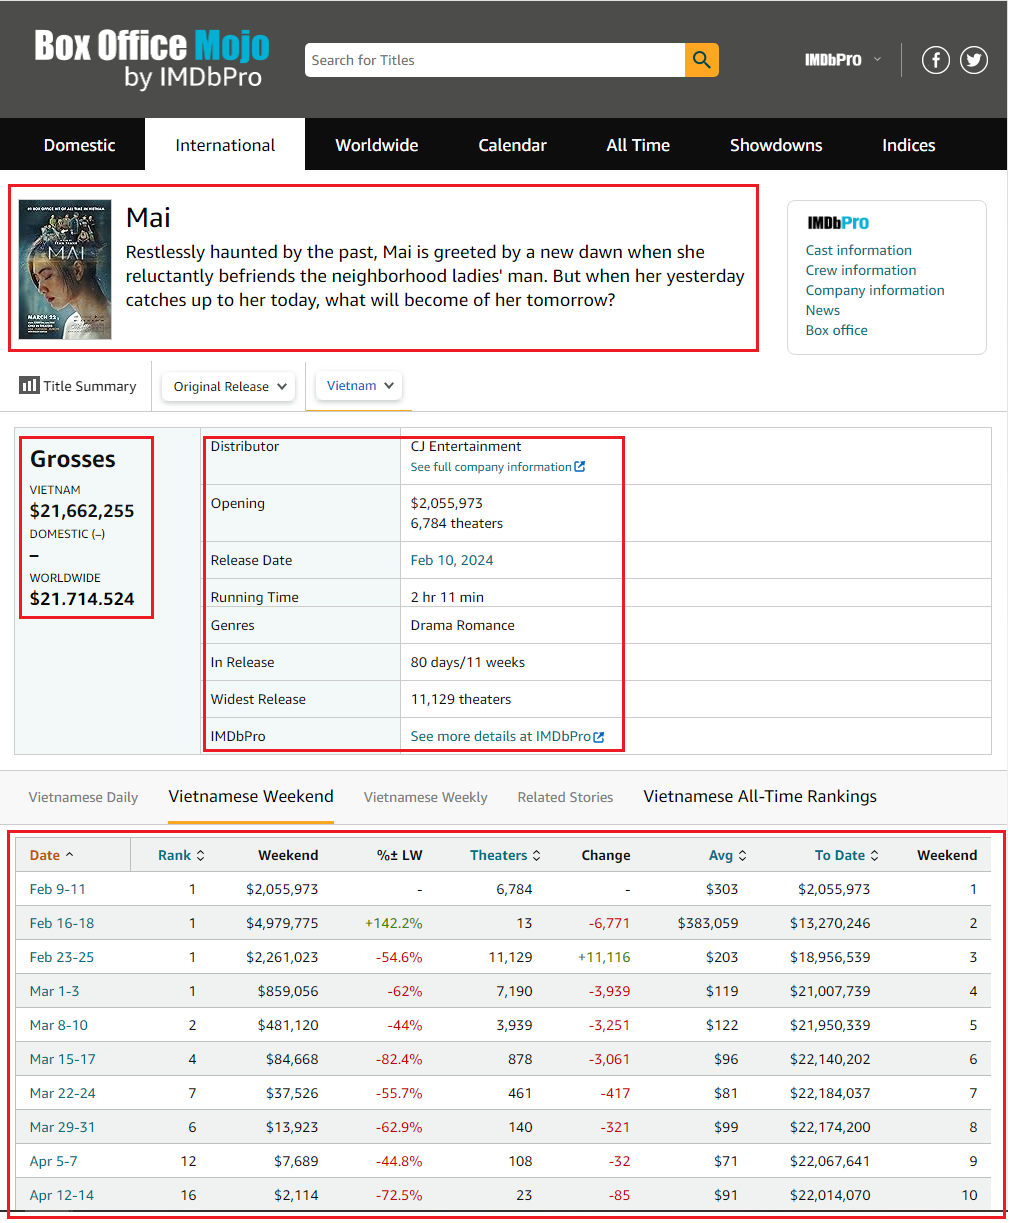
The data I am using from the table marked below from Box Office Mojo website, this can be found in this url. For each movie, there is a link to another page for movie detail information as in the second screenshot. For the movie IMDb rating, countries of origin, languages etc., I also need access to the IMDb website provided by the url hidden in the text "See more details at IMDbPro" but please replace the "pro" in the url text with the blank cause I don't have the membership account. The IMDb website is as the third screenshot below.
The movie data is very unfortunately not easily to access through website APIs or a regular format that I can utilize Power BI, because it needs to combine movie information across multiple webpages. Instead, I use Python and BeautifulSoup as usual to scrape data. The notebook can be found in this Github repository. Dataset is saved into three csv file including movie.csv, calendar_gross.csv, weekend_gross.csv.
Data transformation with Power Query
This dataset represents all movies have been shown in Vietnam from 2009 to April 2024, in which data from 2012 and 2013 is missing. Data includes all about movies but mainly on movie characteristics and financial information.
The csv files from above step will be imported by Power Query into three respective queries movie, calendar_gross and weekend_gross.
- movie: overall information about the movies including name, story line, countries of origin, languages, genres, released date, MPAA, total gross revenue
- calendar_gross: movie gross revenue by calendar years
- weekend_gross: movie gross revenue by calendar weekends.
The scraped dataset is pretty much comprehensive even though missing values or not supplied by the owners appeared across multiple columns in movie tables, mostly the categorical columns. This step is mainly to transform movie genres and languages into multiples queries named movie_genres and movie_languages.
Data modelling, DAX and report visualization
The data model is shown as screenshot below in which one-to-many relationship between movie table and movie_genres, movie_languages, calendar_gross and weekend_gross are created. Two tables movie_genre and movie_language created from transformation step in Power Query, and there is also a separate table named Ranking_filter for report slicer not really contributing to the overal model.
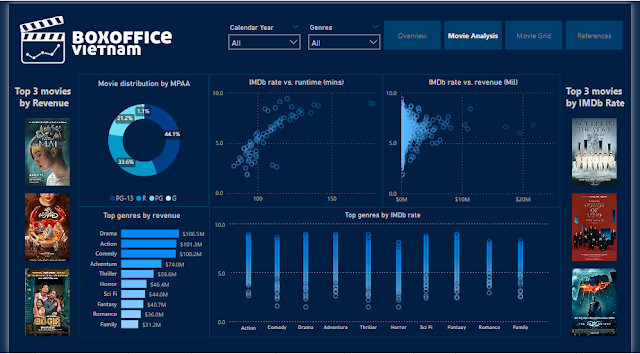
Report Overview
This page shows the overall characteristics of all movies shown in Vietnam from 2009 up to April 2024, mainly emphasized by two combo column-line charts in the middle showing the trend of local revenue and movies by calendar year as well as released year.
No data from 2012 and 2013, and there is a significant drop from 2020 to 2022 due to the global pandemic (COVID-19) and it seems fully recovered in 2023. It's easy to notice a movie released in year of 1997 and still shown in Vietnam recently.
In this page, I created several DAX measures to create the condition format for the column with highest calendar or released year revenue, covert the movie running time in text like "1 hr 40 minutes" into numerical values and calculate the average, calculate the mode of MPAA rate of all the movies.
Movie Analysis
This page gives more insights on the movie analysis, the first scatter plot from the left shows that long movies are likely to be highly rated than short ones by the audiences, and the second plot unveils the fact that in Vietnam, movies with high IMDb rating do not attract viewers as much as domestically produced movies.
The top genres by revenue calculated by using DAX measure to allocate movie revenue to respective genres, because a movie could be classified into more than one genres then revenue will be equally allocated to number of genres. There are other DAX measures to show up top 3 movies by revenue and IMDb rate on the left and right panels.
Movie Grid
This page mainly allows users to explore all the movies in the database, which are sorted either by revenue or IMDb rating. The DAX measures include top 5 movies by revenue or rating by each genre, and top 5 movies with the longest showing time together with revenue.
Link to the report


No comments:
Post a Comment